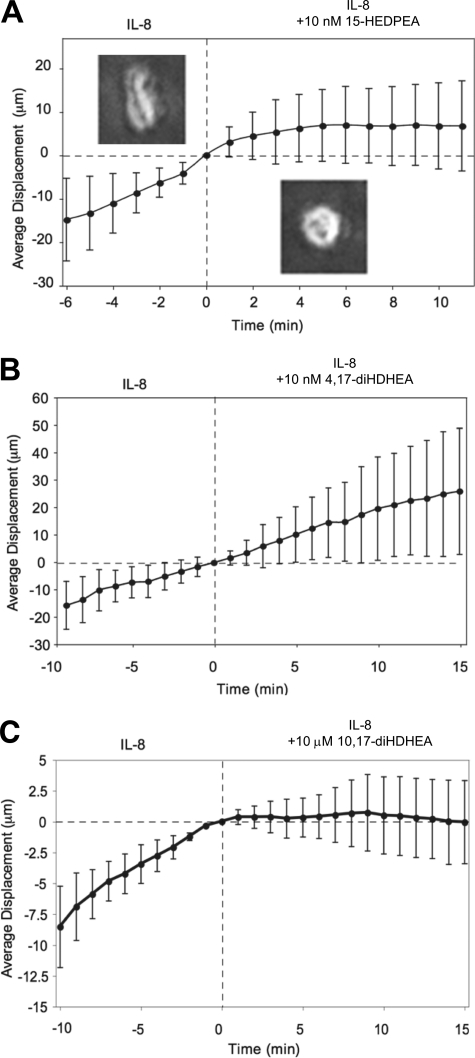
FIGURE 3.
Microfluidic chamber-based screening of human PMN chemotaxis with DHEA-derived products. A–C, representative average PMN directional migration displacement against 0–10 nm IL-8 gradient from original positions (in μm) before and after HPLC-isolated DHEA-derived products were individually infused to the chambers. Insets in A show morphology of PMN before (left side) and after (right side) exposure to 10 nm 15-HEDPEA (average of 23–30 PMN in each panel). Error bars represent migration distance ± S.D. for mean of 26 single PMN (n = 3 separate donors).

