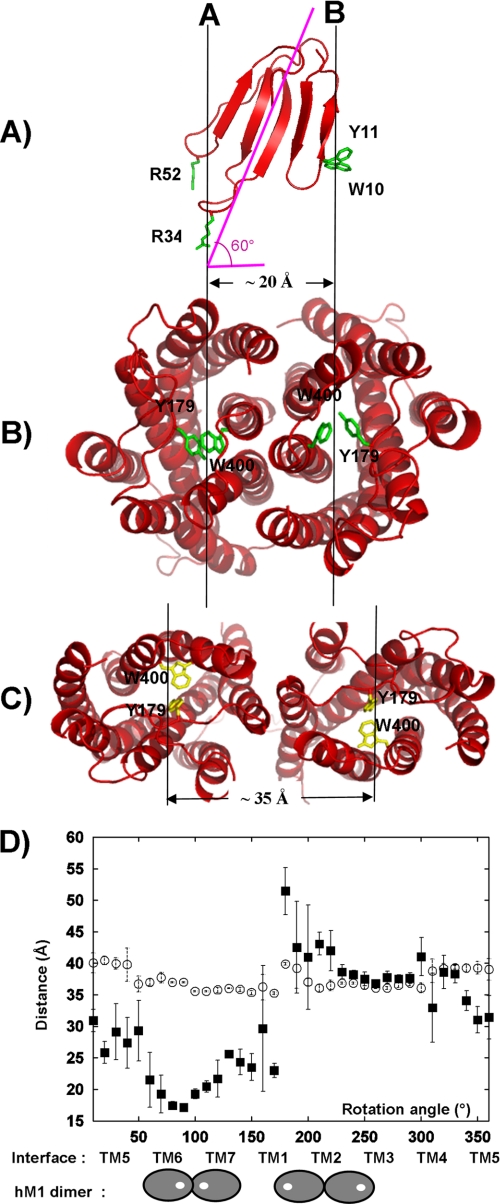
FIGURE 8.
TM interface in MT7-hM1 dimer complex is determined by distance between MT7 loops. A, ribbon representation of MT7 in red with “hot spot” residues Arg-34, Trp-10, and Arg-52 in green. The MT7 principal axis and the orthogonal projection of this axis on the membrane plane are displayed in pink. B, hM1 dimer conformation calculated from our experimental data viewed from the extracellular face (Tyr-179/Trp-400 in green). C, hM1 dimer conformation based on the CXCR4 chemokine structure viewed from the extracellular face (Tyr-179/Trp-400 in yellow). D, measurements of the distances between the two centers of gravity of the protomers of the receptor (○) and the two centers of mass of the MT7 binding sites (Tyr-179/Trp-400) of the protomers (■) during the step by step rotation of each protomer around their vertical axis. Distances are averaged on 10 structures, and the error bars indicate the r.m.s. associated with the average values. Under the graph, the TM involved in the dimer interface is indicated, and in two extreme cases, the localization of the MT7 binding sites in the corresponding dimer configuration is displayed. The hM1 receptor is symbolized by a gray oval, and the MT7 binding site is symbolized by a white circle.

