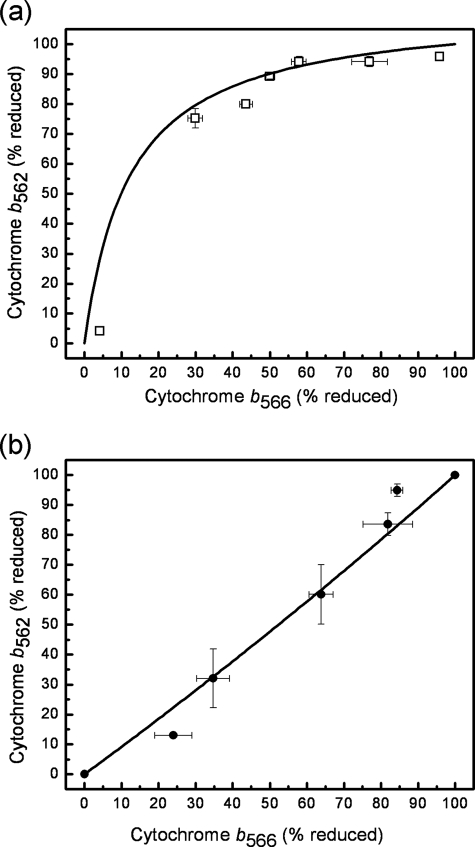
FIGURE 4.
Relationships between the steady-state reduction of cytochromes b562 and b566 in the absence and presence of ATP. Cytochrome b566 was measured at 566–575 nm with correction for cytochrome b562 by subtracting 50% of the signal at 561–569 nm. Cytochrome b562 was measured at 561–569 nm. a, ATP absent, conditions as Fig. 1e. b, 2 mm ATP present, conditions as Fig. 3. Solid curves indicate the best fits of Equation 3, plotted with the relevant values of Edifm, see “Experimental Procedures.”

