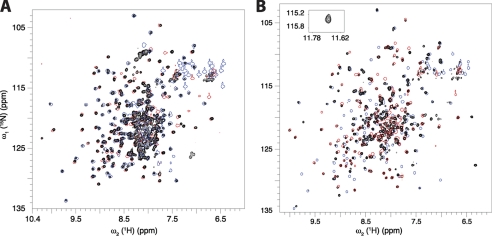
FIGURE 2.
15N TROSY spectrum of the tandem CBD12 construct (black) in comparison with the 15N HSQC spectra of the individual CBD1 (blue) and CBD2 (red) domains. A, apo state; B, Ca2+-bound state. For clarity, the spectra of the isolated domains are drawn using only one contour level. The cross-peak of Gly-503 in the Ca2+-bound state is shown as an inset. The cross-peaks of the linker, which could not be assigned in the Apo state, are likely to fall into the congested central region. The two NMR samples contained 300 μm 2H/15N doubly-labeled CBD12.

