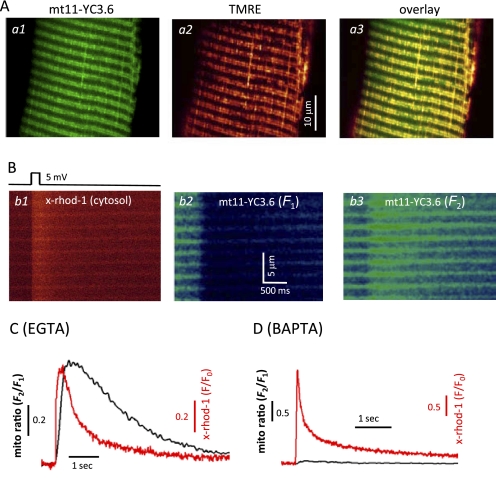
FIGURE 3.
Measurement of mitochondrial Ca2+ uptake using mt11-YC3. 6 biosensor. A, a live muscle fiber expressing mt11-YC3.6 (panel a1) was also incubated with TMRE (panel a2). The overlay (panel a3) shows that mt11-YC3.6 targeted to mitochondria very well. The expression of this biosensor does not change the mitochondrial membrane potential. B, simultaneous recording of cytosolic Ca2+ transient (panel b1) and mitochondrial Ca2+ uptake (panels b2 and b3) during a voltage-induced Ca2+ release. The experiment was done with 5 mm EGTA inside the pipette solution. C, plot of the cytosolic Ca2+ transient presented by the fluorescence change (F/F0) of x-rhod-1 from panel b1 and the change of the mito ratio (F2/F1) of mt11-YC3.6 from panels b3 and b2, which represents the corresponding dynamic change of Ca2+ inside mitochondria during voltage-induced Ca2+ release. D, replacing 5 mm EGTA with 5 mm BAPTA inside the pipette solution dramatically reduced the signal of mt11-YC3.6, indicating that mito ratio in C indeed is an indication of mitochondrial Ca2+ uptake. A 20-mV 50-ms depolarization pulse was applied to induce the Ca2+ release.

