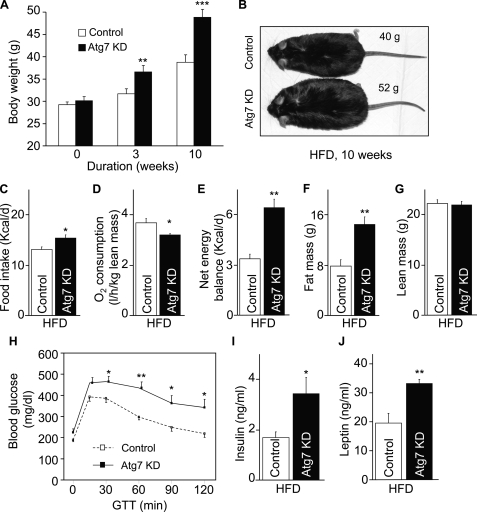
FIGURE 5.
Metabolic phenotype of mice with MBH-specific Atg7 knockdown under HFD feeding. Body weight-matched C57BL/6 mice (chow-fed adult males) with Atg7 knockdown (Atg7 KD) versus the control were generated using bilateral injections of the MBH with lentiviruses containing shRNA against mouse Atg7 or the matched control shRNA. Mice were switched to HFD feeding post-lentiviral injection. A–C, longitudinal follow-up of body weight (A), obesity appearance (B), and average daily food intake (C) of HFD-fed mice at the indicated time points post-MBH injection. *, p < 0.05; **, p < 0.01; ***, p < 0.001; n = 10 - 12 per group. Data are presented as mean ± S.E. KD, knockdown. D, metabolic chamber assessment of energy expenditure was performed for a subgroup of HFD-fed mice at week 3 post-injection. *, p < 0.05; n = 4 per group. Data are presented as mean ± S.E. E, net energy balance was calculated by subtracting energy expenditure ((3.815 + 1.232 × VCO2/VO2) × VO2, Columbus Instruments) from energy intake for mice at week 3 post-injection. **, p < 0.01; n = 4 per group. Data are presented as mean ± S.E. F and G, MRI assessment of fat mass (F) and lean mass (G) was performed at 3 weeks post-injection. **, p < 0.01; n = 12 per group. Data are shown as mean ± S.E. H–J, mice were analyzed with a glucose tolerance at week 4 post-injection (H) and for fasting blood insulin (I) and leptin (J) concentrations at week 10 post-injection. *, p < 0.05; **, p < 0.01; n = 6–12 per group. Data are shown as mean ± S.E. GTT, glucose tolerance test.

