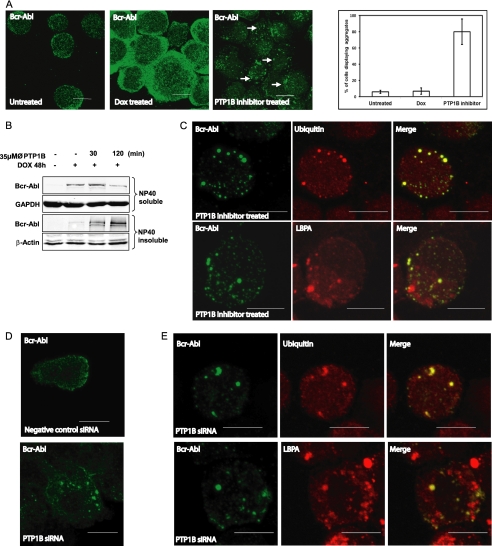
FIGURE 5.
Bcr-Abl forms ubiquitinated aggregates following PTP1B inhibition. A, TonB.210 cells were untreated (left panel) or treated with DOX for 48 h to induce Bcr-Abl expression (middle panel). DOX-treated cells were also treated with the PTP1B inhibitor for 2 h (right panel). Cells were processed for immunofluorescence microscopy and immunostained with the anti-c-Abl antibody (green). The graph on the right displays quantitation of the number of cells displaying Bcr-Abl aggregates following PTP1B inhibition. A minimum of 100 cells was analyzed per experiment, and results are expressed a mean percentage ±S.D. of at least four independent experiments. B, TonB.210 cells were treated with PTP1B inhibitor (∅, PTP1B) for 30 and 120 min. After treatment with the drug, cells were lysed with radioimmune precipitation buffer to obtain the Nonidet P-40 (NP40)-soluble fraction. The Nonidet P-40-insoluble pellet was further treated with SDS buffer to obtain the Nonidet P-40-insoluble fraction. Detergent-soluble or -insoluble fractions were subjected to SDS-PAGE and Western blot analyses using c-Abl. GAPDH and β-actin served as the loading controls. C, TonB.210 cells treated with DOX for 48 h and PTP1B for 2 h were immunostained for Bcr-Abl (left panels) and co-stained with ubiquitin (top middle panel) and LBPA (bottom middle panel) with the merged images displayed on the right-hand panels. Bcr-Abl is stained green, and ubiquitin and LBPA are stained red. D, TonB.210 cells were treated with DOX and either negative control siRNA (top panel) or PTP1B siRNA (bottom panel) for 72 h followed by immunostaining with anti-c-Abl antibody. E, TonB.210 cells treated with DOX and PTP1B siRNA for 72 h were immunostained for Bcr-Abl (right panels) and ubiquitin (top middle) or LBPA (bottom middle) with merged images displayed on the right. Scale bar is 10 μm.

