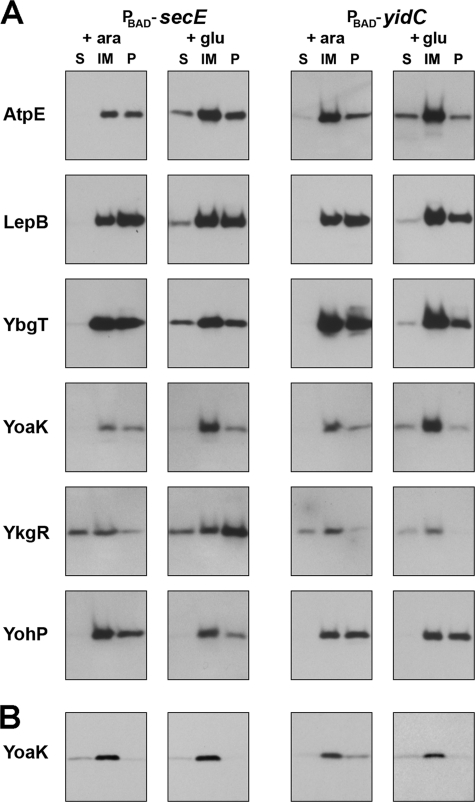
FIGURE 4.
Partitioning of proteins after depletion of YidC and SecE. Examples of A, SPA-tagged proteins and B, 3× FLAG-tagged YoaK detected by immunoblot assays after subcellular fractionation using a sucrose cushion. Cells were grown in the presence of 0.2% arabinose to express SecE or YidC or in the presence of 0.2% glucose to deplete either YidC or SecE. The intensities of the bands from the soluble (S), inner membrane (IM), and pellet (P) fractions were measured for diluted samples and used to determine the relative abundance of the tagged protein in each fraction. For YkgR, ratio of the pellet fraction to all fractions combined (soluble, inner membrane, and pellet) was used to determine whether translocation was affected by depletion. For all other proteins, the ratio of the soluble fraction to all fractions combined was used to determine whether translocation was affected by depletion. The calculated ratios are given under Table 3 and supplemental Table S6.

