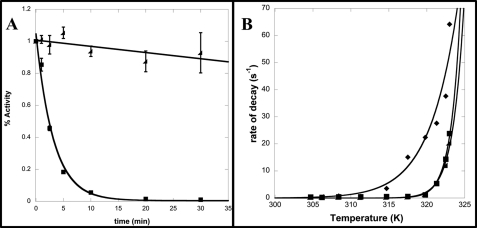
FIGURE 4.
Kinetic thermostability of CapD, CP, and F24H. A, shown is a plot of the fraction of remaining activity versus time for CapD (■) and CP (◢) at 45 °C. The data were fit to a first-order exponential decay to determine the rate of decay. Errors bars represent S.D. from three independent measurements. B, the rates of decay were determined by fitting five individual time points using nonlinear regression to an exponential decay function for temperatures ranging from 30 to 50 °C for CapD (♦), CP (■), and F24H (◢). These data were then fit using nonlinear regression to the Arrhenius equation. The calculated free energy of inactivation and 95% confidence interval for CapD, CP, and F24H are 56.2 ± 11, 144 ± 15, and 163 ± 13 kilocalories/mol, respectively.

