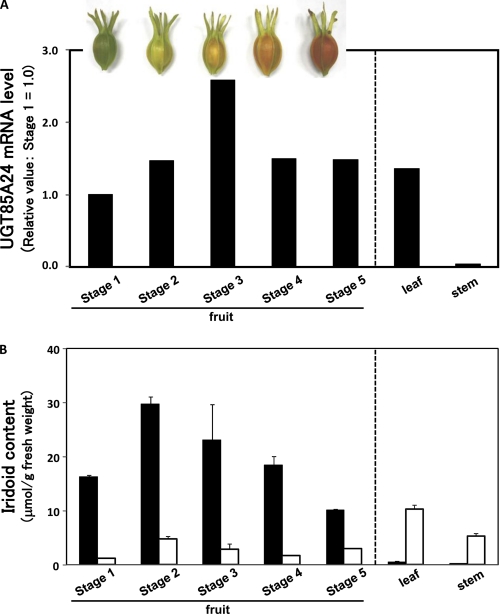
FIGURE 8.
Temporal and tissue distribution of UGT85A24 mRNA (A) and iridoid glucosides (B) in G. jasminoides. A, fruits, leaves, and stems were collected from a single G. jasminoides plant on the same day, powdered in liquid nitrogen, and stored until used. The fruits were classified into five maturation stages based on the red coloration. Total RNA and methanol extract were prepared from the tissues and used for RT-PCR analysis and HPLC analysis, respectively. B, closed and open bars represent contents of geniposide and gardenoside, respectively, and represent average values with S.D. from five replicates.

