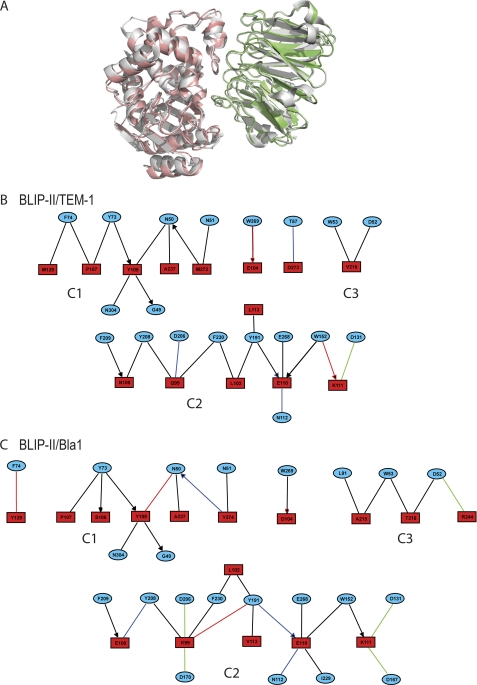
FIGURE 5.
Modular architecture of the BLIP-II interfaces. A, the crystal structure of the BLIP-II-TEM-1 (Protein Data Bank code 1JTD) complex (gray) is shown superimposed against the BLIP-II-Bla1 (green-red) structure (28). The modular architecture of the BLIP-II-TEM-1 (B) and BLIP-II-Bla1 (C) interfaces were determined using the AquaProt server (see “Experimental Procedures”). The blue circles and red boxes contain the BLIP-II and β-lactamase residue labels, respectively. The color of the edge represents van der Waals, hydrogen bonds, aromatic, and electrostatic interactions as black, blue, red, and green colors, respectively. An edge containing an arrowhead indicates a side-chain-backbone interaction, whereas the remaining edges are side-chain-side chain interactions. The diagrams were made using the motif analysis and visualization tool, MAVisto (72).

