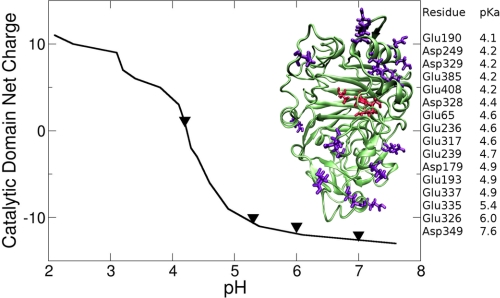
FIGURE 11.
Left, calculated net charge of the catalytic domain as a function of the solution pH; triangles indicate the pH values of the SANS experiments. A schematic representation of the enzyme is shown in the inset, with the ionizable residues in violet and the catalytic residues in red. Right, approximate pKa values of the ionizable groups calculated employing the H++ method (35, 36).

