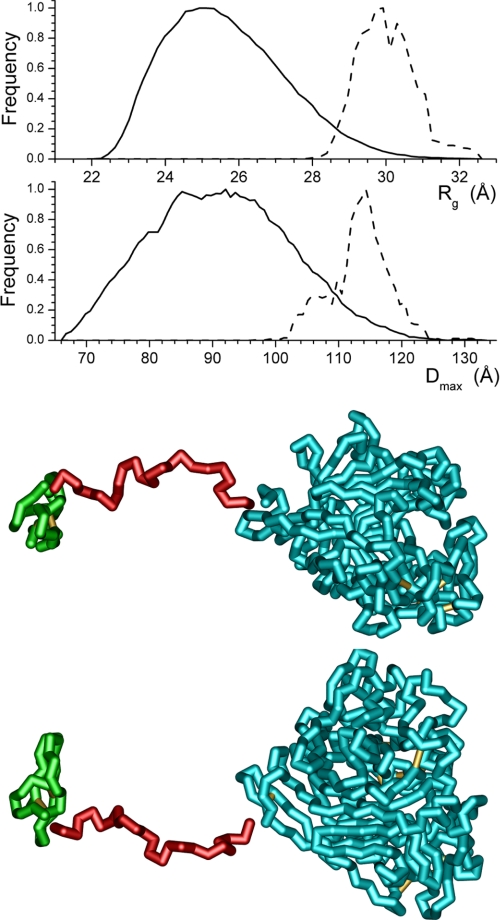
FIGURE 9.
Structure distributions produced by the EOM modeling (28) from the SANS data collected at pH 5.3 using the high resolution structure of the catalytic core (10, 11) (shown in cyan) and cellulose binding domain (12) (shown in green). The solid lines are the distributions produced by the software, whereas the dashed lines are the final distributions of structural parameters from the models selected by the ensemble optimization process. The structure shown, which is the selected model having the highest frequency, is rotated 90° about the long axis of the structure to produce the two views. The breaks in the structure at the ends of the linker are shown to highlight the domains.

