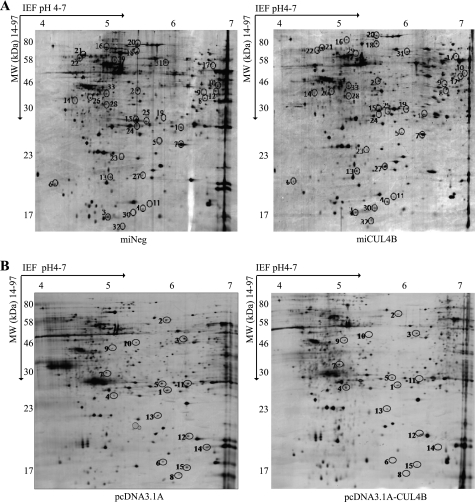
FIGURE 1.
Two-dimensional gel electrophoresis electrophoretograms (A) of miNeg HEK293 cells and miCUL4B HEK293 cells (B) and pcDNA3.1 A and pcDNA3.1 A-CUL4B HEK293 cells. Cell lysates containing 450 μg of total protein were loaded for two-dimensional gel electrophoresis analysis. The gels were silver stained and analyzed using PDQuest two-dimensional electrophoresis by Bio-Rad. Differentially expressed proteins are marked with numbers in the gel maps.

