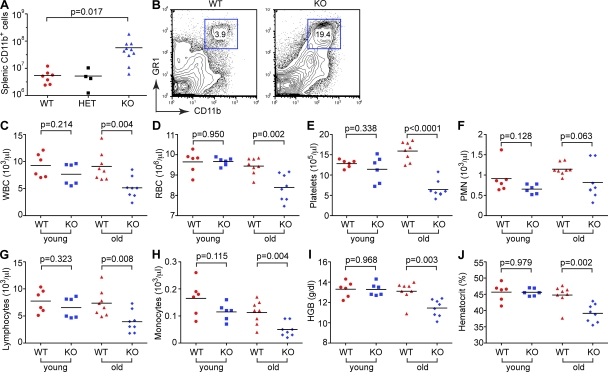
Figure 5.
Myeloproliferation and BM failure in aging miR-146a−/− mice. (A) Absolute cell counts of myeloid cells (CD11b+) in WT (n = 7), miR-146a+/− (HET; n = 4), and miR-146a−/− (KO; n = 10) spleens. Results are shown as means and are representative of two independent experiments. (B) FACS analysis of myeloid cells in WT and KO spleens. Gated are Gr1 and CD11b double-positive cells. Numbers indicate percentage of cells in the gate. Data are representative of three independent experiments. (C–J) Complete blood count test with differential examination of peripheral blood from young (∼4 mo old; n = 6 for both genotypes) and old (∼14 mo old; n = 8 for both genotypes) WT and miR-146a−/− (KO) mice. (C) Absolute white blood cell counts. (D) Absolute red blood cell counts. (E) Absolute thrombocyte counts. (F) Absolute neutrophil counts. (G) Absolute lymphocyte counts. (H) Absolute monocyte counts. (I) Hemoglobin concentration. (J) Blood hematocrit. (A and C–J) P-value calculations were performed using Student’s t test. Experiments in B–J were performed using the B6/miR-146a−/− strain of mice. The experiment A was performed in 129.B6/miR-146a−/− mice.

