Figure 6.
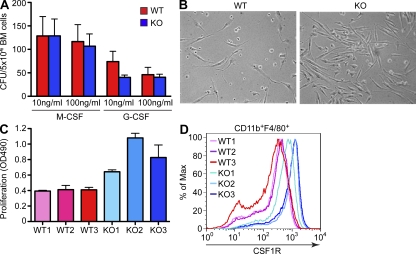
miR-146a–null BMDMs proliferate more robustly in response to M-CSF and express more CSF1R on their cell surface. (A) Analysis of myeloid precursor cells by colony-forming cell assays. BM cells from WT and miR-146a–null mice (KO) were grown for 10 d in methylcellulose in the presence of the indicated concentrations of recombinant M-CSF or G-CSF, and the number of macrophage and granulocyte CFUs was scored under a microscope. (B) Photographs of proliferating in response to 50 ng/ml M-CSF BMDM cultures, derived from WT and miR-146a−/− (KO) mice. Pictures were taken on day 3 after cell plating and are representative of several biological replicates. Data are representative of two independent experiments. (C) Quantification of cellular proliferation of differentiating BMDM cultures from WT and miR-146a−/− (KO) mice in response to 50 ng/ml M-CSF. Three age- and gender-matched mice were used per genotype. Cell proliferation was assessed by MTS assay on day 3 after cell plating. Data are representative of two independent experiments. (A and C) Data are represented as mean ± SD. (D) FACS analysis of cell surface CSF1R expression on BMDM cells, derived from three WT and three miR-146a−/− (KO) mice as described in C. Cells were pregated for CD11b and F4/80 markers first. Data are representative of two independent experiments. All experiments were performed using the B6/miR-146a−/− strain of mice.

