Figure 3.
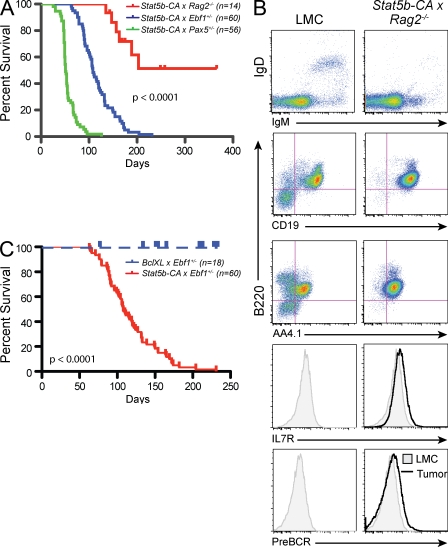
Role of proliferation and survival in tumor induction. (A) Kaplan-Meier survival analysis of mice of the indicated genotypes. (B) Flow cytometric analysis of lymph node cells from Stat5b-CA x Rag2−/− tumor mice. Representative flow cytometric analysis of B220, AA4.1, IL-7R, pre–BCR, CD19, IgM, and IgD expression on lymph node cells is shown. In histogram plots, LMC is represented as shaded plot with line and the black line referred to as tumor represents cells isolated from the lymph nodes of indicated leukemic mouse. Doublets were gated out and a lymphocyte gate was set based on side and forward scatter properties. All gates shown are based on bone marrow isolated from control C57BL/6 mice (LMC). Each mouse indicated in A was analyzed. (C) Kaplan-Meier survival analysis of mice of the indicated genotypes.

