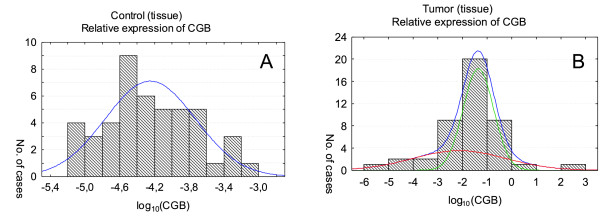
Figure 1.
CGB gene expression in tissue lacking of cancerous changes (A) and tumor tissue (B). Relative expression levels are presented as the logarithm to the base 10. In order to distinguish populations with homogeneous genes' expression the maximal likelihood method for one- and multiplied normal distribution was used. The histograms include one (A) and two (B) normal distribution of CGB expression. In case of tumor tissue (B) two normal distributions' sum create the final approximation - higher curve in the graph.

