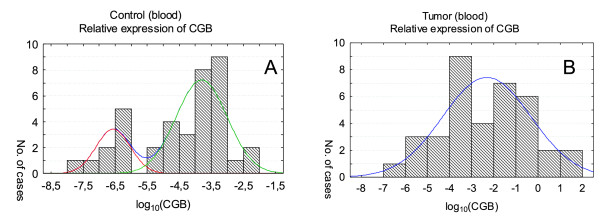
Figure 3.
CGB expression in peripheral blood of healthy volunteers (A) and patients with cancer (B). Relative expression levels are presented as the logarithm to the base 10. CGB activity was fitted to two (A) and one normal distribution (B) in blood of healthy volunteers and cancer patients, respectively. The final approximation of CGB expression curve in control blood (A) is hidden due to the presence of non-overlapping components.

