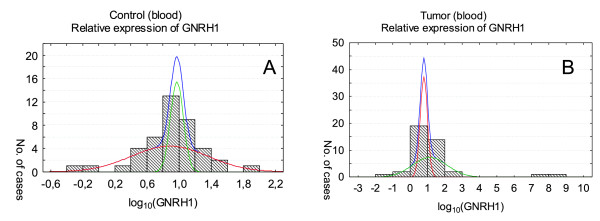
Figure 4.
GNRH1 expression in peripheral blood of healthy volunteers (A) and patients with cancer (B). Relative expression levels are presented as the logarithm to the base 10. Analysis of GNRH1 expression blood of healthy volunteers (A) and patients with cancer (B) in both cases showed two distributions of results. The higher curve represents the sum of these two distributions.

