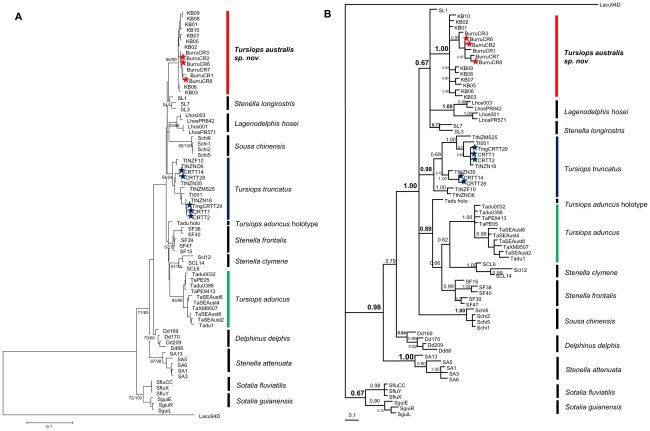
Figure 3. Phylogenetic analysis of the mtDNA control region haplotypes (A–B).
Haplotypes specific to the study are denoted by ★ red = Tursiops australis sp. nov., blue = T. truncatus. (A) Consensus tree obtained by Maximum Likelihood and Neighbour-joining methods from mtDNA control region haplotypes. Tree is rooted with the outgroup Lagenorhynchus acutus. Bootstrap values >50% are indicated (1000 replicates: ML left value; NJ right value)(intra-species specific values not reported). (B) Majority rule consensus tree from Bayesian reconstruction (MrBayes) with posterior probabilities branch support values.

