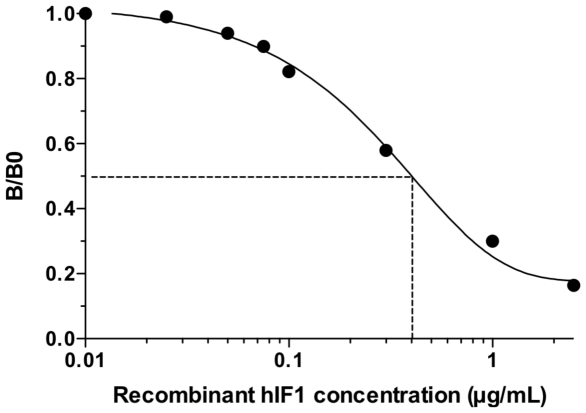
Figure 3. Typical standard curve used for IF1 quantification.
Competitive ELISA was performed using rIF1-coated plates (0.5 µg/mL) and biotinylated anti-IF1 polyclonal antibody pre-incubated with different dilutions of rIF1 (0 to 2.5 µg/mL). The colorimetric signal (OD 450 nm–OD 570 nm) is expressed as a part of the maximum signal obtained without rIF1, B/B0. The standard curve shows that fifty percent displacement of binding was obtained at a concentration of 0.4 µg/mL rIF1.

