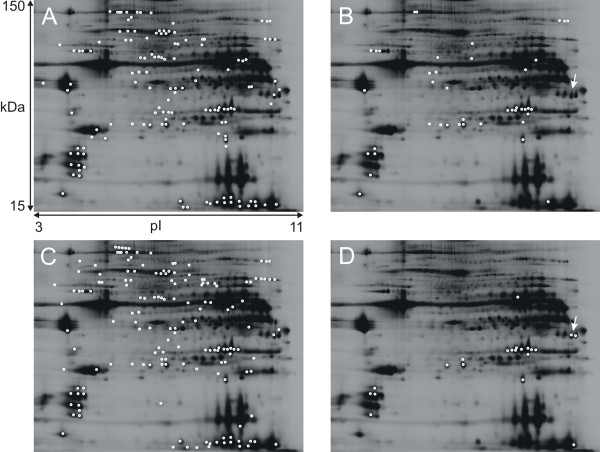
Figure 1.
Protein spots of interest using different statistical and pre-processing techniques. Trapezius muscle homogenate on 12.5% preparative gel scanned with Typhoon scanner™. pH range 3-11 and molecular weight 15-150 kDa. 1A: Proteins spots significant according to the one-way ANOVA analysis, not FDR correlated. 1B: Protein spots significant according to the one way ANOVA and FDR correlated. 1C: Protein spots of interest in the PLS-DA model: VIP-values higher than 1 and a regression coefficient with a jack-knifed 95% confidence interval not including 0. 1D: Proteins spots significant according to one-way ANOVA and FDR correlated, when a spot volume exclude filter of 200 000 au is applied. Arrows indicate spots identified as phosphoglycerate mutase 2 (P15259).

