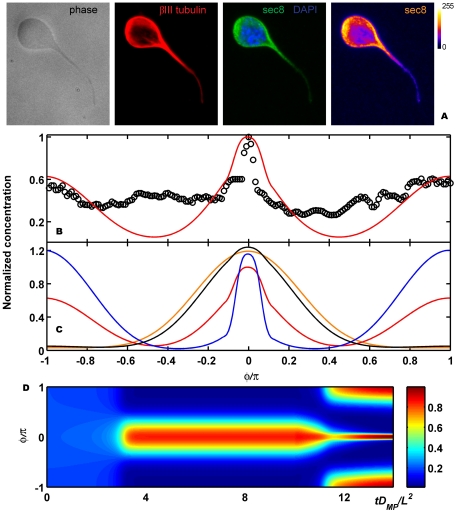
Figure 5. Polarity domain formation in neurons with one neurite.
(A) Hippocampal neurons were fixed shortly after plating and immunolabeled with a neuron-specific anti- tubulin antibody (red), an anti Sec8 antibody (green) and a nuclear marker (blue). The right panel shows a pseudocolor image of Sec8 only. Scale bar
  . (B) Experimental results, Sec8, compared with numerical simulation,
  . The normalized Sec8 intensity of a single neuron is represented by open circles. The base of the first neurite is located in the center (0 degree) of the graph. The red line shows the normalized numerical results for a membrane growing with speed
  at
at  . Initial profile (orange) as well as profiles at
  for different speeds (
 , black;
  , red;
  , blue) are shown in (C). Profiles are normalized with respect to the maximum value of the red line. In (D) the temporal evolution of the normalized concentration of membrane proteins for a cell with a growing membrane is presented, growth starts at
  and
and  , (
, ( axis, angular membrane position;
  axis, time; color scale, normalized concentration values). For a dynamic representation see Movie S1. For all the simulations kinetics parameters are as in Fig. 4.

