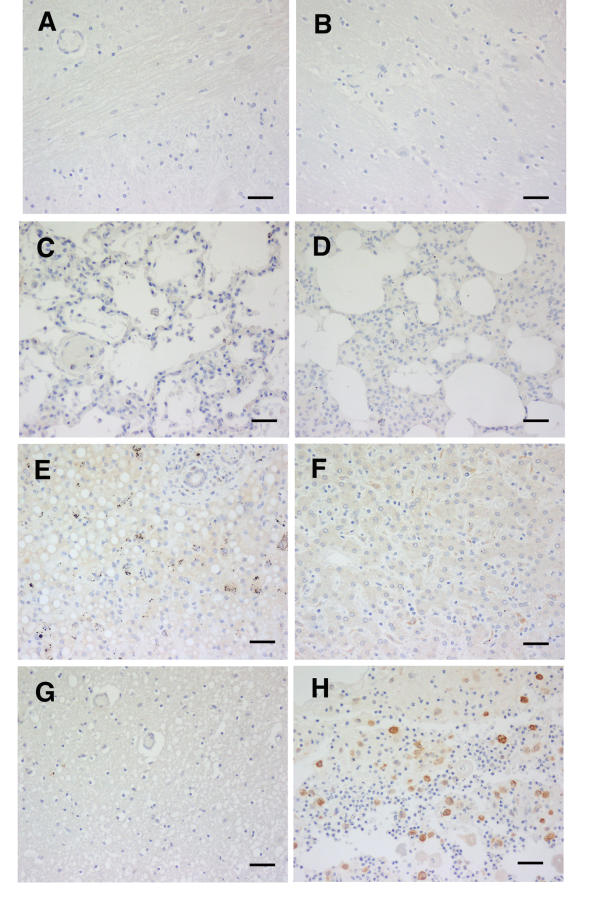
Figure 5.
HO-1 staining of tissues from controls. A and B brain, C and D lung, and E and F liver of African controls, cases 41 (A, C and E) and 43 (B, D and F). Australian origin coronary artery disease brain (G) and chronically infected pilonidal sinus (H) are also shown. Pattern shown was the same in all cases illustrated. Scale bar, 100 μm.

