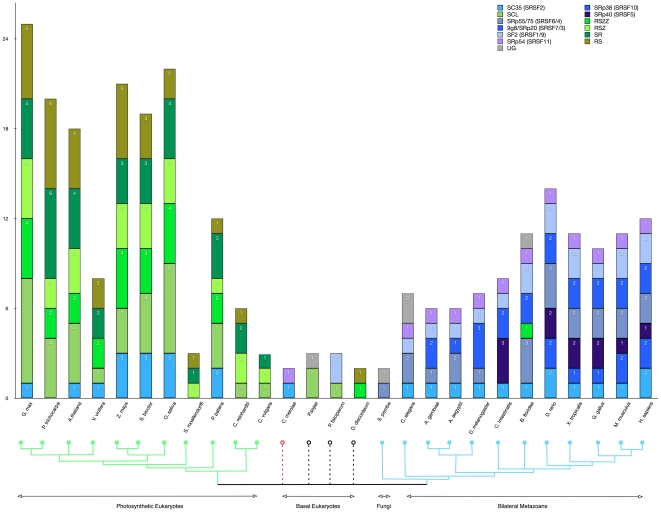
Figure 2. Sub-family classification of SR genes.
Based on the trees presented in Figure 1 and Figure S2, we plotted the SR clades by organism. The inferred taxonomic grouping from Figure S1 is plotted below the bar chart and the number of SR genes per family is indicated by color codes as well as value labels. Note: SRp40 (SRSF5) is shown in its own grouping to highlight the divergence of the insects from the predominantly mammalian SRp55/75 (SRSF6/4) clades.

