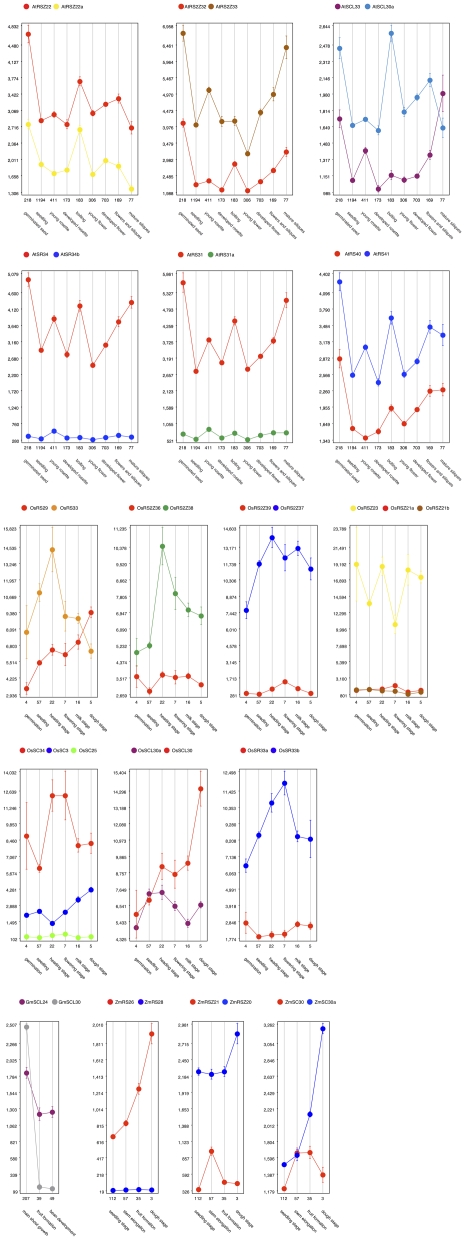
Figure 4. Differential expression of SR gene pairs.
Gene expression data for various developmental stages were taken from the Genevestigator database [54] and plotted for each of the six pairs of paralogous SR genes. In some cases (in rice), there were three paralogs included. The numbers below the x-axis indicate the number of microarray experiments that underlie the average intensity value plotted on the y-axis.

