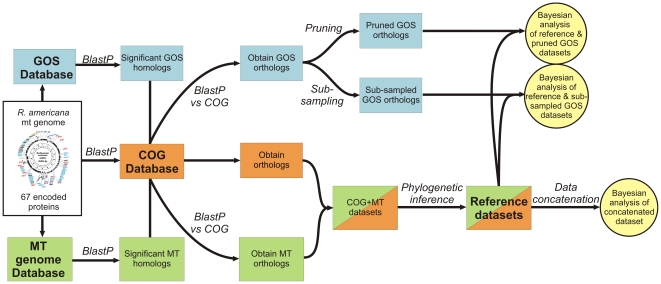
Figure 1. Schematic overview of data selection procedure.
The flow scheme depicted here displays which datasets have been used and how they were analysed (for more details, see Materials and Methods). Three different datasets have been used, being the COG database (taken from STRING [40]; “COG”, orange shading), the GOS database (“GOS”, blue shading), and a local database of proteins that are encoded by mitochondrial genomes (‘MT’, green shading). First, homologs were retrieved for each of the 67 proteins encoded by the R. americana mitochondrial genome for each of these datasets using BlastP searches. Next, paralogs and distant homologs were removed from the retrieved GOS and MT hits by performing BlastP searches against the COG database and using stringent cut-off filters. Since the amounts of retrieved GOS homologs was too high for Bayesian analyses, two strategies were used for down-sampling: One approach involved a pruning step in which the amount of GOS homologs was reduced while reducing the phylogenetic diversity, another approach involved the targeted sub-sampling of GOS sequences that were placed as a neighbour to the mitochondrial clade in a jack-knifing screen (see Material and Methods for details). Then, the MT and COG datasets were combined and subjected to phylogenetic analysis (PhyML), selecting only those proteins whose evolutionary history was evolutionary coherent (i.e. Alphaproteobacteria formed one clade, and mitochondria formed one clade). The resulting protein datasets are referred to as the ‘reference datasets’. The reference datasets were used for three independent analyses: (i) Proteins of the reference dataset were concatenated and subjected to Bayesian analysis; Proteins of the reference dataset were either combined with the pruned (ii) or sub-sampled (iii) GOS datasets, followed by Bayesian analysis.

