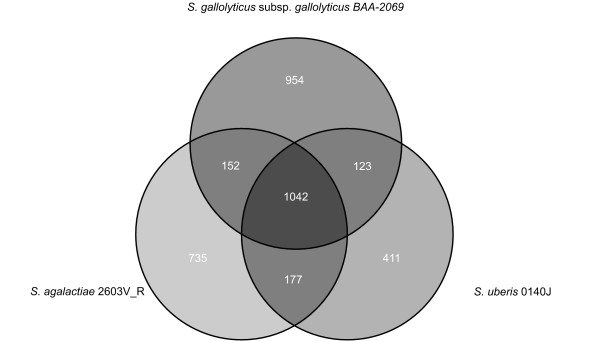
Figure 3.
Venn diagram of different streptococcal genomes. Venn diagram revealed by EDGAR analysis [37]. Numbers in intersections represent the number common to two or three species. Venn diagram representing common and strain-specific genes of S. gallolyticus subsp. gallolyticus BAA-2069, S. uberis 0140J and S. agalactiae 2603V_R.

