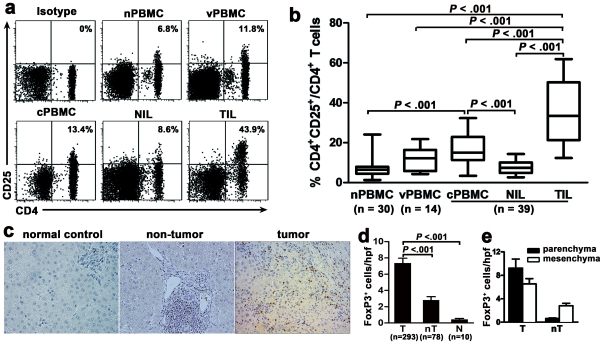
Figure 1. CD4+CD25+FoxP3+ Tregs are highly enriched in tumors of HCC patients.
Tregs (CD4+CD25+ T cells) were gated from CD3+ T cells by flow cytometry. (a, b) Representative plots (a) and statistical analysis (b) show that the frequency of CD4+CD25+ T cells was higher in HCC patients, especially among TIL. The percentages in (a) represent the frequency of CD4+CD25+ T cells among CD4+ T cells. The data in (b) are expressed in box plots, in which the horizontal lines illustrate the 25th, 50th and 75th percentiles. (c, d) Representative images (c) and statistical analysis (d) of immunohistochemical staining of FoxP3+ lymphocytes in the tumor and non-tumor tissue from HCC patient and normal control liver. Magnification, ×200. The data in (d) show that the number of FoxP3+ cells is significantly higher in tumor than in non-tumor or normal control. hpf, high-powered field. (e) Statistical analysis shows FoxP3+ cells preferentially aggregate in the parenchyma of tumors.

