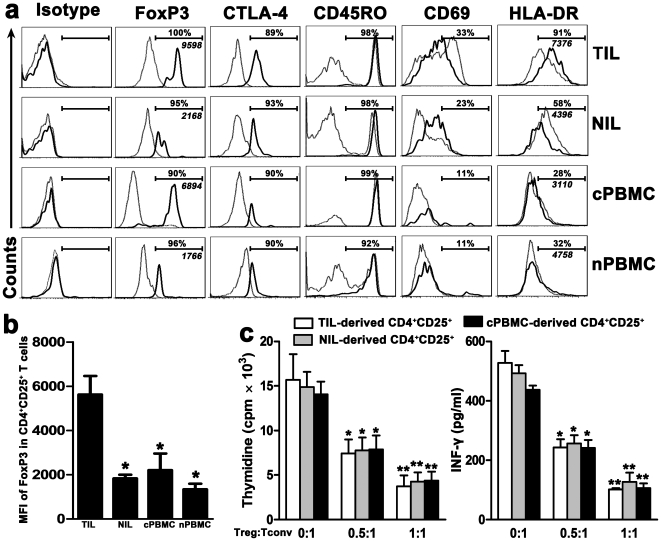
Figure 2. Phenotypic and functional analysis of CD4+CD25+ Tregs in HCC patients.
(a) Representative FoxP3, CTLA-4, CD45RO, CD69 and HLA-DR expression profiles in CD4+CD25+ (thick line) and CD4+CD25− (dotted line) T cells from the four studied groups. Specific isotypes were used as negative control. The percentages represent the frequencies of various markers on CD4+CD25+ T cells. The italic numerical values represent MFI of FoxP3 in CD4+CD25+ T cells. (b) Statistical analysis shows that the MFI of FoxP3 in CD4+CD25+ T cells from TIL was significantly higher than those from NIL, cPBMC, and nPBMC. *P<0.05, compared with TIL. (c) Purified CD4+CD25+ T cells (Tregs) from TIL, NIL, and cPBMC could similarly inhibit the proliferation and INF-γ production of autologous CD4+CD25− T cells (Tconv) in a dose-dependent manner (n = 3 for each group). *P<0.05; **P<0.01, compared with autologous controls (Treg∶Tconv = 0∶1). Data in (b) and (c) represent the mean±S.E.M.

