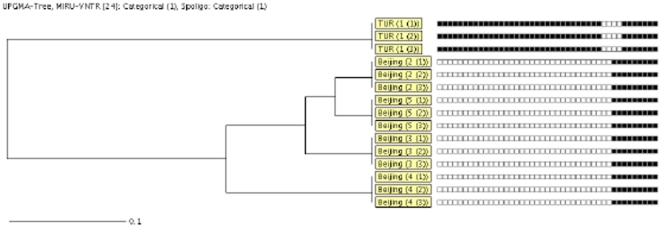
Figure 3. UPGMA tree showing the comparison of the cavity isolates from 5 patients based on the combined similarities of both the 24-loci MIRU-VNTR and spoligotype results determined by using the categorical coefficient.
Clustered isolates are labeled with a bar. From left to right are shown: box consisting of the MTB lineage and patient number (cavity no.), and spoligotype pattern.

