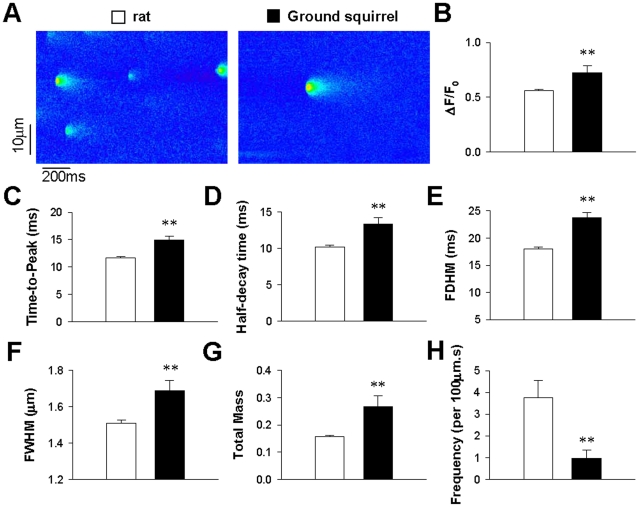
Figure 5. Spontaneous Ca2+ sparks.
(A) Line-scan images of spontaneous Ca2+ sparks in ventricular myocytes from rats (left) and ground squirrels (right). (B) The spark amplitude (ΔF/F0). (C) The time-to-peak. (D) The half-decay time. (E) The full duration at half-maximum (FDHM). (F) The full width at half-maximum (FWHM). (G) The total signal mass presented in arbitrary units (A.U.). (H) The frequency of Ca2+ sparks calculated by dividing the total number of sparks by the product of distance (µm) and time (s) of line scanning. **P<0.01 (n = 270 sparks in 6 rats and 53 sparks in 5 ground squirrels).

