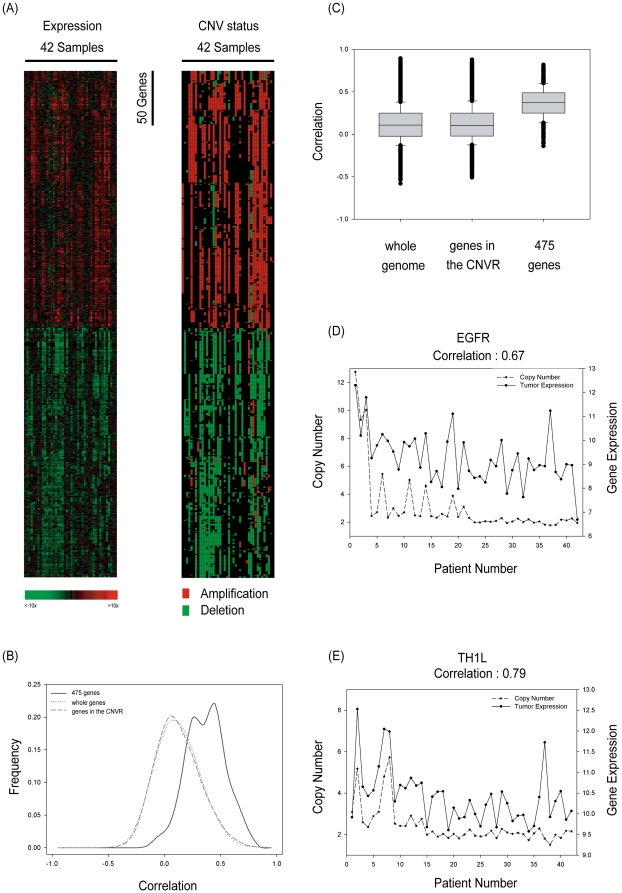
Figure 2. Expression profiles of CNV-driven genes.
(A) Hierarchical clustering of the 475 CNV-driven genes. For gene expression (left column), the input data of each gene was normalized to its Z-value, which was obtained through two-step calculations. First, for each gene, corresponding copy number neutral samples were used as a normalization baseline, that is, the median probe intensity in the normal tissue was subtracted from probe intensities in all the samples. Next, adjusted probe intensity was divided by the standard deviation of probe intensity among copy number neutral samples to get the normalized Z-value. One-way hierarchical clustering was performed on these Z-values of gene expression. Red color indicates up-regulated genes; green color indicates down-regulated genes. For CNV status (right column), the corresponding chromosome changes are plotted in the same gene order as gene expression. Red color denotes amplification and green denotes deletion. (B) Distribution of Pearson correlation coefficients among the 475 CNV-driven genes was plotted against that from the genes located within the CNVRs. (C) Box plot of correlations among the 475 CNV-driven genes. (D–E) The Pearson correlation coefficient was utilized to describe the association between copy number and gene expression in tumor tissues for (D) EGFR and (E) TH1L. Copy number is shown on the left y-axis; gene expression is shown on the right y-axis in a log scale.

