
Fig. 4. Deletion of MMR1 affects mother-daughter age asymmetry.
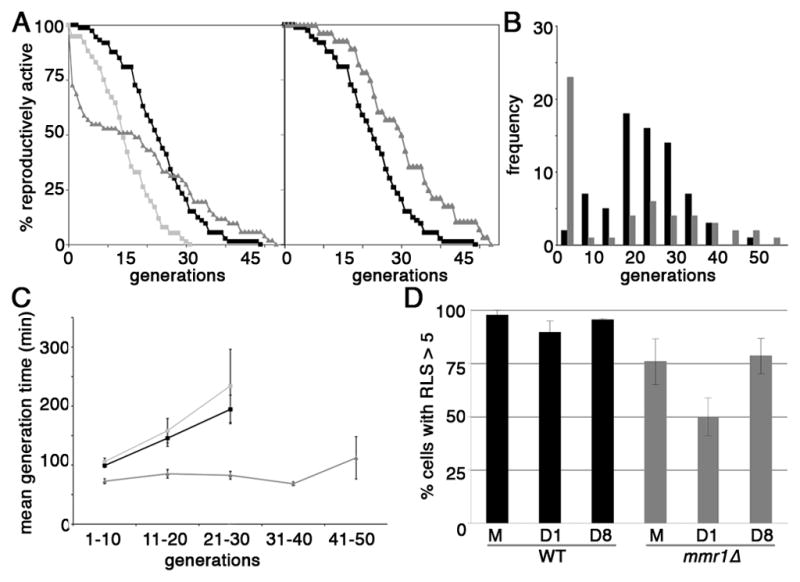
(A) Left panel: RLS of BY4741 (ν; n = 73), mmr1Δ (σ; n = 51) and sir2Δ (ν; n = 76) cells were measured as described in Materials and Methods, using pheromone treatment to distinguish virgin mother cells from their mothers. The data shown is pooled from 3 independent experiments. Right panel: RLS of wild-type cells (ν) and the long-lived subpopulation of mmr1Δ (σ) cells. Short-lived mmr1Δ cells, which have a RLS < 5 generations, were removed on the basis of their lifespan distribution histogram (Fig. 4C). The remaining cells were corroborated to be long-lived by their clustering in a plot of RLS versus mean generation time from 0–10 generations (Fig. S3). B) Histogram of the RLS distribution of wild-type (black) and mmr1Δ (grey) cells. C) Mean generation time for wild-type (BY4741) (ν; n = 91), sir2Δ (ν; n = 55) and long-lived mmr1Δ cells (σ; n = 43) as a function of replicative age (generation). The data shown is pooled from 2 independent experiments. Generation time is the time from the last cell division to mother-bud separation, the latter of which was assessed by physically separating mothers from buds using a micromanipulator on a dissecting microscope. Generation time was averaged over 10 generations. Error bars: standard error of the mean. D) Percent of cells with RLS > 5 generations in mother cells (M) and their first (D1) and eight (D8) buds in wild-type and mmr1Δ cells. The data are pooled from 2 independent experiments, where n = 40 for each cell type studied in each experiment.