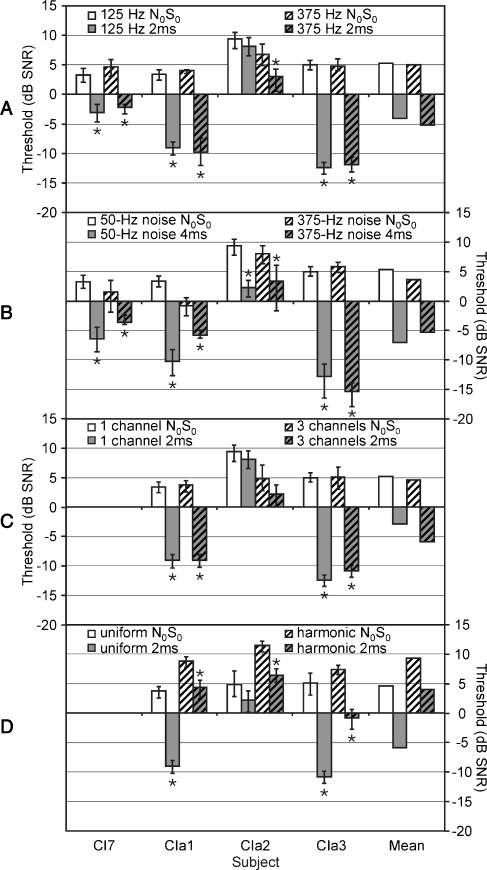
FIG. 7.
Signal detection thresholds (in decibels SNR) in diotic (N0S0—white) and dichotic (N0Sτ—gray) conditions for A different sine wave frequencies (125 Hz—plain bars versus 375 Hz—hatched bars), B different noise bandwidths (50 Hz—plain bars versus 375 Hz—hatched bars), C different number of channels (one—plain bars versus three—hatched bars), and D uniform stimulus (plain bars) versus harmonic complex (hatched bars) on three channels. The size of the interaural delay in the N0Sτ condition was dependent on the stimulus type and is indicated in the legend. Error bars depict 90% confidence intervals. Non-overlapping error bars indicate significant differences (also indicated with stars).

