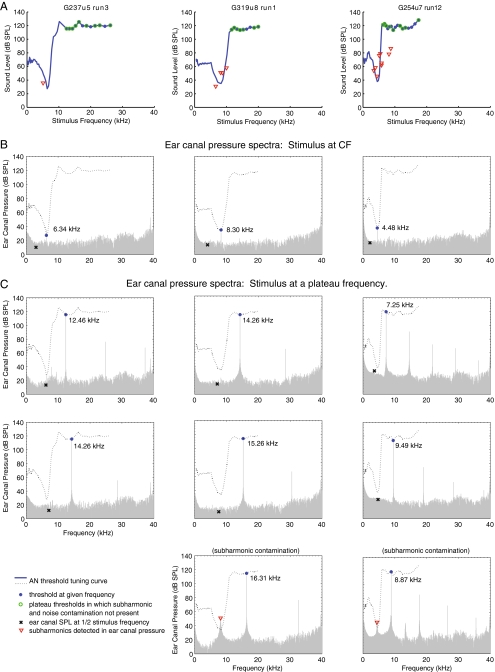
FIG. 7.
EC stimuli at plateau threshold levels. A FTCs for three ANFs (G237u5-3, G319u8-1, and G254u7-12, also shown in Figures 3, 4, 5, and 6). B–C Representative examples of EC pressure spectra while a stimulus tone was presented during acquisition of the corresponding FTCs. B EC pressure spectra with stimulus tone at CF. C Cases of EC pressure spectra with stimulus at a plateau frequency without subharmonic contamination (first two rows) and with subharmonic contamination (bottom row). The blue filled circle symbol denotes the stimulus tone that was produced by the speaker at a threshold level. To distinguish the plateau region from the rest of the FTC, only the plateau thresholds were labeled with blue filled circles. For each plateau threshold, subharmonic components were inspected. The red triangle symbol denotes the ear drum produced subharmonic if it was detected inside the EC. If no subharmonic above the noise floor could be detected, the level of the noise floor was noted instead and denoted by the black X symbol. To determine if any pressure other than the stimulus fundamental inside the EC could potentially be excitatory to this particular ANF, the FTC of the same ANF was also plotted in the pressure spectrum as a black dotted curve. A plateau threshold is labeled with a green open circle in the FTCs in A, if no excitatory pressure other than the stimulus fundamental existed inside the EC. Note: the actual acoustic noise floor might be lower than what was shown in the spectra.

