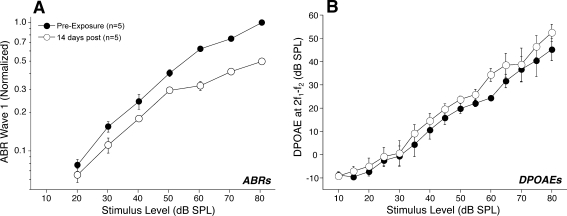
FIG. 3.
Although ABR and DPOAE thresholds return to normal after noise exposure, ABR wave 1 amplitude is significantly reduced (A), whereas DPOAE amplitudes recover fully (B). Data are group means (± SEMs) for five animals tested at 16 kHz before and 2 weeks after exposure to the 4–8 kHz octave-band noise at 106 dB for 2 h (a different group of animals than those shown in Fig. 2). A For each animal, the wave 1 amplitudes (baseline to peak) are normalized, i.e., expressed as a fraction of the pre-exposure amplitude measured in response to 80 dB tones. B DPOAE amplitudes are shown as absolute sound pressure levels. Stimulus level refers to f2; f1 level is always 10 dB greater.

