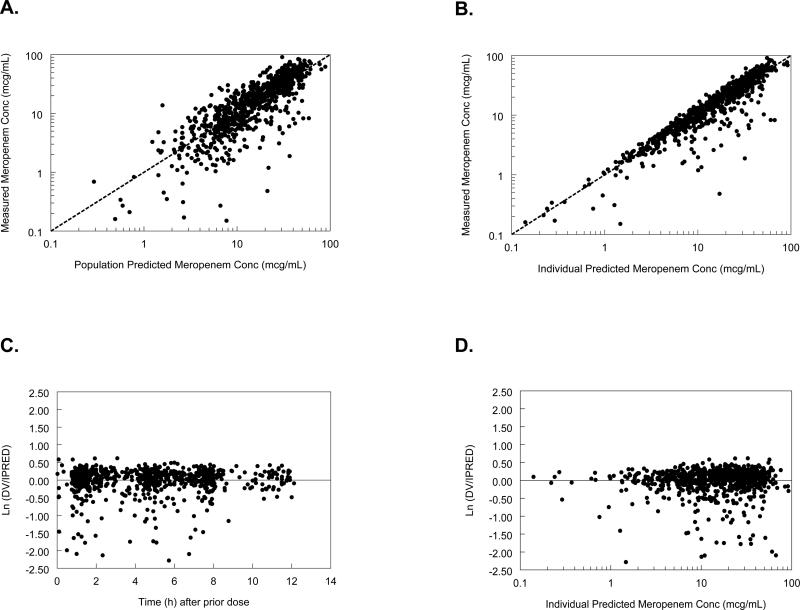
FIGURE 1.
Goodness-of-fit figures: A) and B), measured versus population predicted (PRED) and individual predicted (IPRED) concentrations in the final model; C) and D), weighted residuals plot for the final population PK model versus time after previous dose and IPRED, respectively. LN(DV/IPRED) indicates natural log of the ratio of the observed concentration (DV) divided by the predicted individual concentrations (IPRED); DV, dependent variable (observed meropenem concentrations).

