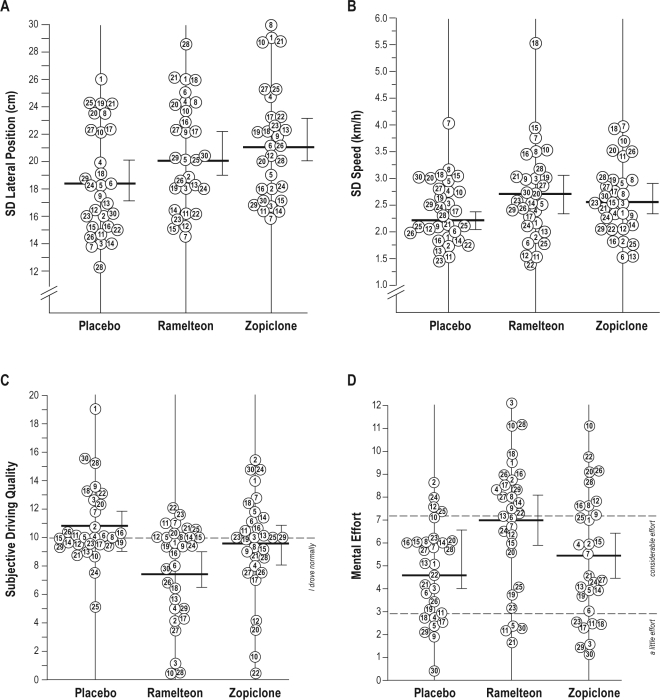
Figure 2.
Driving test results. Individual data for (A) standard deviation of lateral position (SDLP), (B) standard deviation of speed, (C) subjective driving quality, ranging from 0 meaning “I drove exceptionally poorly” to 20 “I drove exceptionally well” around a midpoint of 10 “I drove normally” and (D) mental effort to perform the test; examples of statements provided at anchorpoints along the VAS scale are displayed next to the dashed lines. Same numbers represent same subjects. Group mean and 95% confidence interval are indicated for each treatment.

