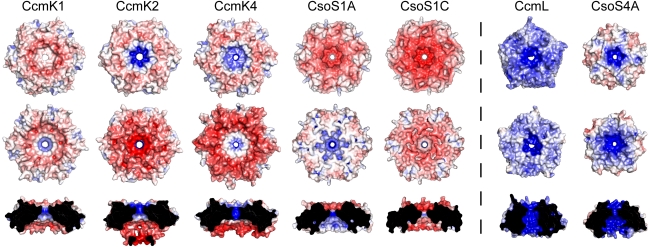
Fig. 6.
Electrostatic comparison of structurally characterized single-domain BMC [PDB:3BN4 (CcmK1), 2A1B (CcmK2), 2A10 (CcmK4), 2G13 (CsoS1A), 3H8Y (CsoS1C)] proteins and pentameric shell proteins [PDB:2QW7 (CcmL), 2RCF (CsoS4A)]. Convex (top), concave (middle), and pore cross-section (bottom) views are shown for each structure. Red denotes negative charge; blue denotes positive charge [Figure generated with APBS Plug-in (Baker et al. 2001) for PyMOL]

