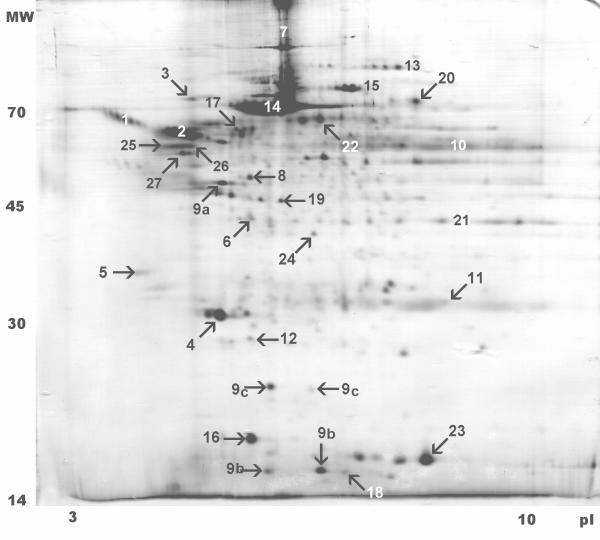
Figure 2.
Two-dimensional electropherogram of human microdialysate. This figure shows a real image sample of a cerebral microdialysate electrophoresis gel with annotated gel spots. We found an average of 158 ± 24 protein spots in the gels (N = 18), of which 95 could be identified by subsequent mass spectrometry and database search, representing 27 different proteins.

