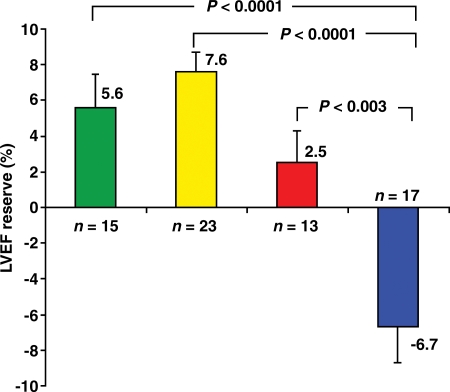
Figure 4.
Relationship between the extent of CAD and LVEF reserve. Bar graph demonstrates the inverse relationship between the extent of angiographic CAD (>70% stenosis) and the stress-induced change in LVEF. Each bar represents the mean LVEF reserve (ie, change in LVEF from rest to peak stress) on gated perfusion PET scans obtained in patients with 0- (green), 1- (yellow), 2- (red), or 3-vessel or left main (blue) CAD at invasive coronary angiography. (Reprinted, with permission, from reference 38.)

