
Figure 1.
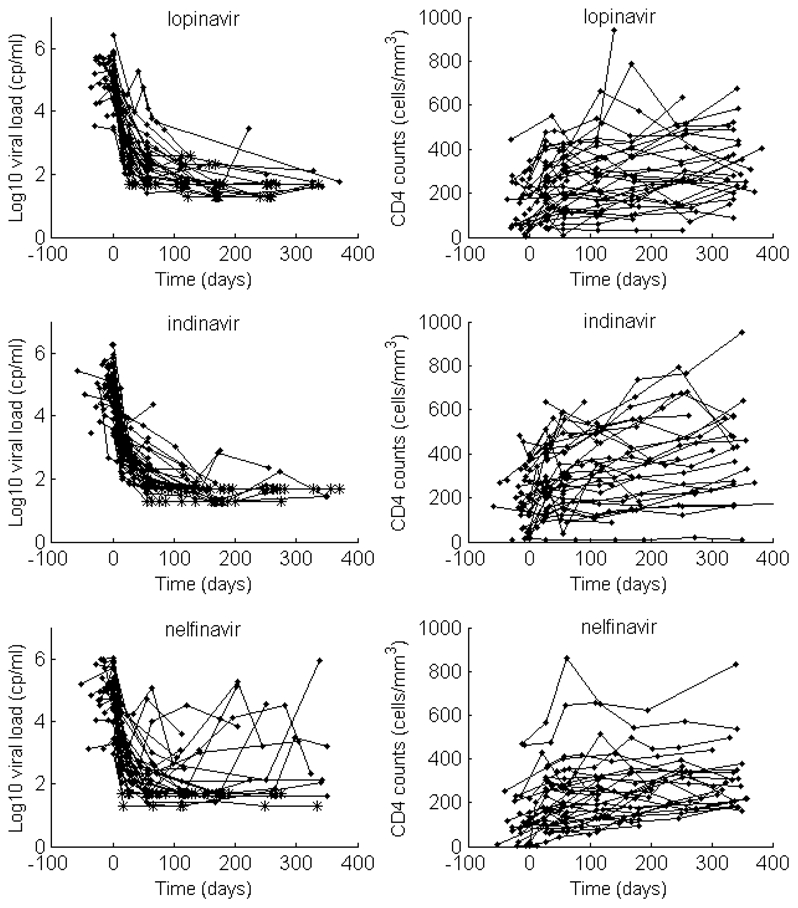
Observed viral load decrease (left) and CD4 increase (right) after treatment initiation in the three PI groups: lopinavir (top), indinavir (middle) and nelfinavir (bottom)
Official websites use .gov
A
.gov website belongs to an official
government organization in the United States.
Secure .gov websites use HTTPS
A lock (
) or https:// means you've safely
connected to the .gov website. Share sensitive
information only on official, secure websites.
Observed viral load decrease (left) and CD4 increase (right) after treatment initiation in the three PI groups: lopinavir (top), indinavir (middle) and nelfinavir (bottom)