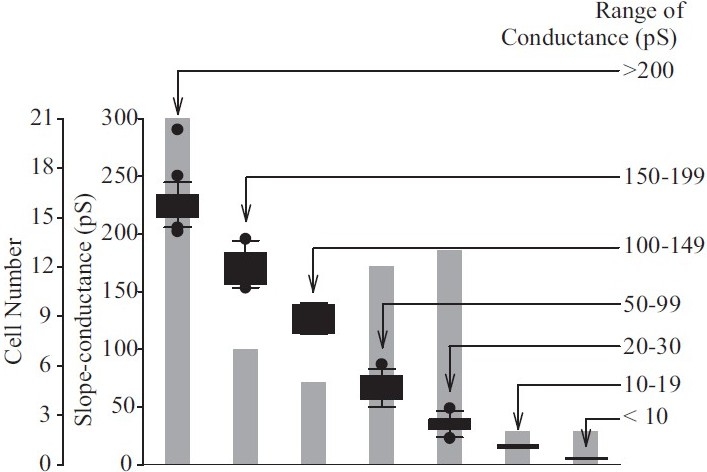
Figure 11.

Range of single-channel conductances of K+ channels observed in human pulmonary artery smooth muscle cells (PASMC). Floating bar graph showing modes, medians and ranges of the seven conductance classes identifi ed in human PASMC. The number of cells exhibiting particular channel conductances is indicated by the gray-shaded bars
