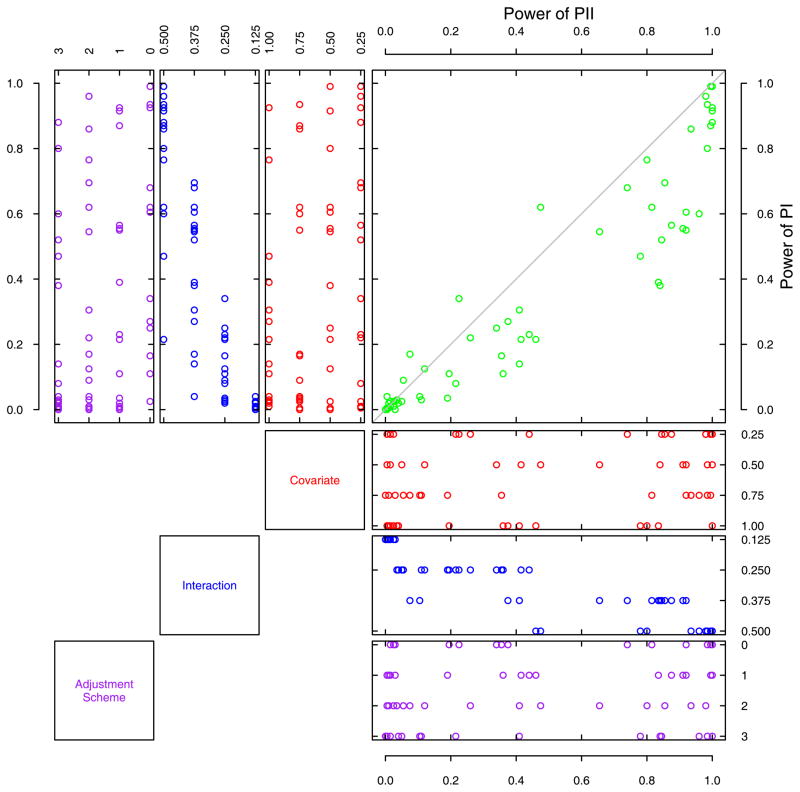
Figure 3.
A Probability-Probability plot of the power of PI and PII across 64 scenarios for continuous traits simulated under the diagonal model in the mixed families design. In the main panel, the horizontal and the vertical axes are statistical powers of PII and PI, respectively, and the horizontal and the vertical coordinates of each point are determined by the statistical power of PII and PI of a given scenario. The distributions of the simulation parameters are represented graphically in the vertical panels and the horizontal panels for PI and PII, respectively (in the mixed families design, minor allele frequency and parental missing genotype rates were built-in parameters in generating populations). The distributions of the simulation parameters are represented graphically in the vertical panels and the horizontal panels for PI and PII, respectively. The meanings of the vertical and horizontal axes are the same as in their corresponding panels in Figure 2.

