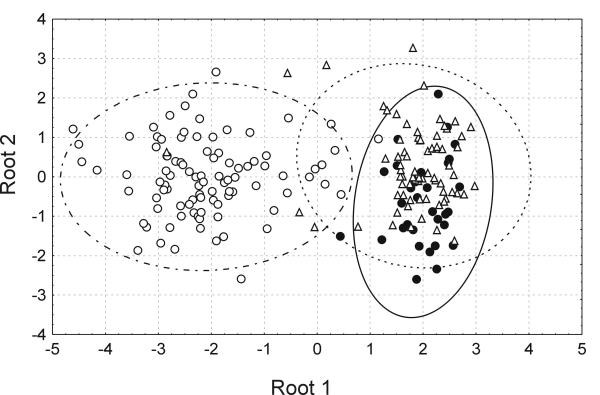
Figure 1.
Classification of donors and patients according to the multivariate discriminant function analysis including studied coagulation parameters. Dispersion ellipses (95%CI) are drawn based on the coordinates of two orthogonal discriminant functions (roots) estimated in the course of a stepwise forward discriminant function analysis (overall Wilk's lambda = 0.191, p « 0.0001), including five variables (factor X, protein C, prothrombin F1+2, fibrinogen and APTT ratio), each with a tolerance of at least 0.5. Analysis performed on log-transformed data in three groups: healthy donors (group I) (●), patients who were non-users of OAT (group II) (△) and OAT users (group III) (○).

