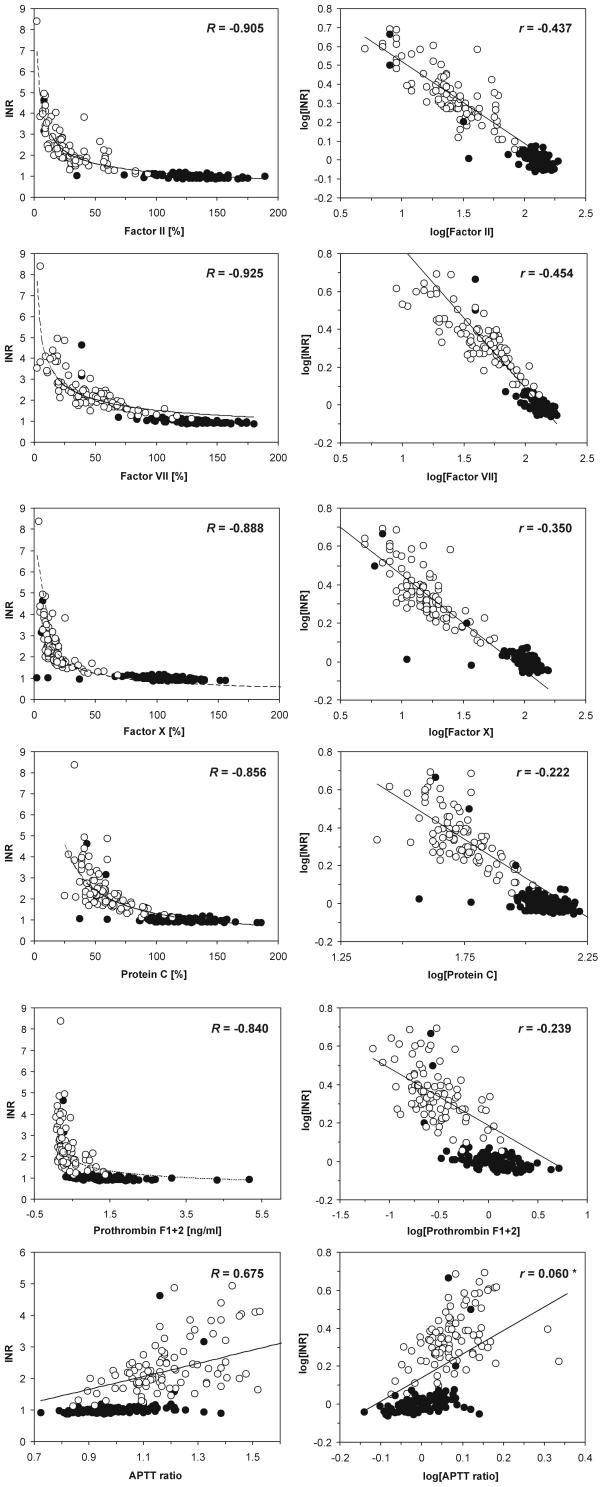
Figure 2.
Relationships between INR and plasma clotting factors, protein C and F1+2 prothrombin fragments in normal donors and patients on OAT. Cases representing patients on OAT are marked as open circles (○), those representing healthy donors or patients not receiving OAT are marked by closed circles (●). For non-linear associations of raw data (left panel) correlation coefficients represent Spearman's non-linear correlation; for log transformed data correlation coefficients represent partial correlation (for the model including all variables); insignificant coefficients marked with an asterisk, for the remaining p « 0.0001; coefficients estimated for whole set of experimental data (n = 203). In both methods the lines were computer-fitted to the data using the quasi-Newton algorithm.

