Figure 4.
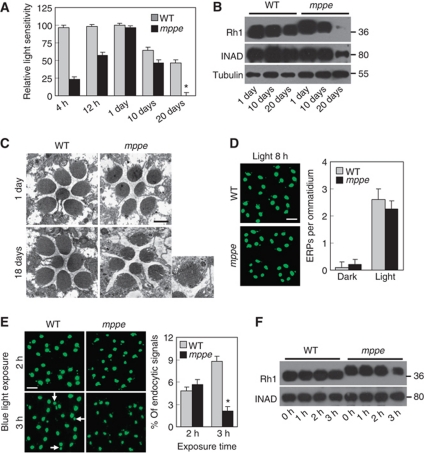
Glycosylated Rh1 is not stable once it is endocytosed, and leads to retinal degeneration. (A) Quantification of light sensitivities in wild-type and dmppe mutant flies. Flies were raised in 12 h light/12 h dark conditions. Newly eclosed adults were collected and reared for the indicated time. For 1-day-old flies, collected adults were reared for 24 h. Relative light sensitivity was measured and calculated as described in Materials and methods. (B) Rh1 and INAD levels decreased in the older mutant. Tubulin was probed as a loading control. The reduction of INAD level indicates the older mutant undergoes retinal degeneration. (C) EM analyses revealed the older mutant underwent retinal degeneration. Flies were raised in 12 h light/12 h dark conditions for the indicated time. Each picture shows a single ommatidium. One degenerated rhabdomere from the mutant is enlarged in the right panel. Scale bar, 2 μm. (D) Glycosylation does not affect light-induced endocytosis of Rh1. Two-day-old dark-reared flies were stimulated with white light (700 lux) for 8 h and stained with the monoclonal Rh1 antibody. Scale bar, 5 μm. (E) Rh1 distribution after blue light stimulation. Two-day-old, dark-reared flies were stimulated with pure blue light (700 lux) for 2 or 3 h. Cross-sections were prepared and stained as described in Materials and methods. Three large endocytic Rh1 particles in the cell bodies are marked with arrows. Scale bar, 5 μm. The right panel shows the ratio of Rh1 signal intensity in the cell body for each genotype and treatment. Quantification was performed as described in Materials and methods. (F) Rh1 level decreased in the mutant after 3 h under blue light stimulation. Two-day-old, dark-reared flies were stimulated with pure blue light (700 lux) for the indicated time. After stimulation, fly heads were collected and total Rh1 levels were compared by western blots. INAD was probed as a loading control. *indicates that the sample is significantly different from the control (P<0.01; Student's t-test).

