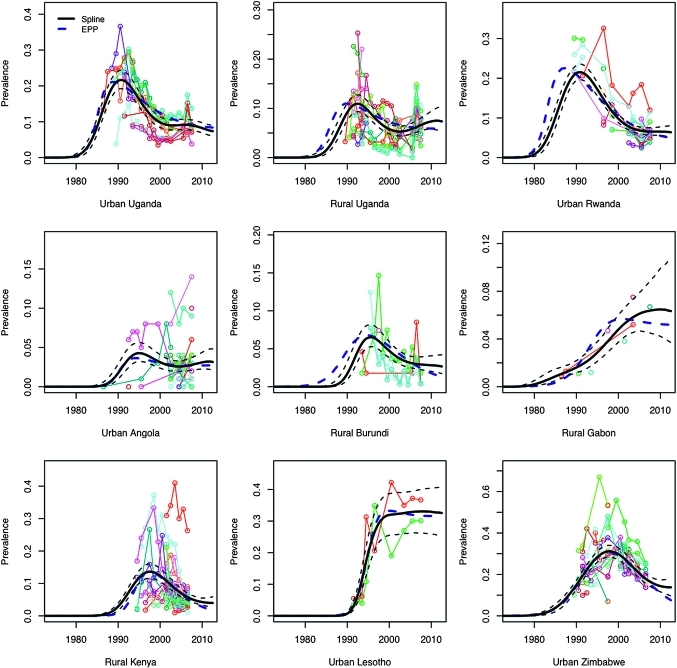
Figure 2.
Median prevalence with 95% credible intervals (in black) for the spline-based model for r, with the best fit from the EPP 2009 Reference Group model added for comparison (in blue) for nine selected settings. Observed prevalence data for antenatal clinic sites to which the models are fit are plotted in various colours.

